 termal
Monitoring · Alerts · Connector
Server monitoring without installing an agent — and alerts with no rules to write.
If a server has a Termalin Connector, it is already monitored. Once a minute Termalin reads the server's health figures over the connection that is already there, draws them as charts in the web cabinet, and tells you when something is wrong — a disk about to fill, a failed service, a certificate about to expire. Nothing extra to install, nothing to configure.
Part of Pro and Team · included in the 14-day Pro trial · on by default for every Connector
01 / what you see
A dashboard for every server, with nothing to build.
Open termal.in/account → Server metrics. Each server with a Connector has its own dashboard, over any range from the last 15 minutes to the full history of your plan.
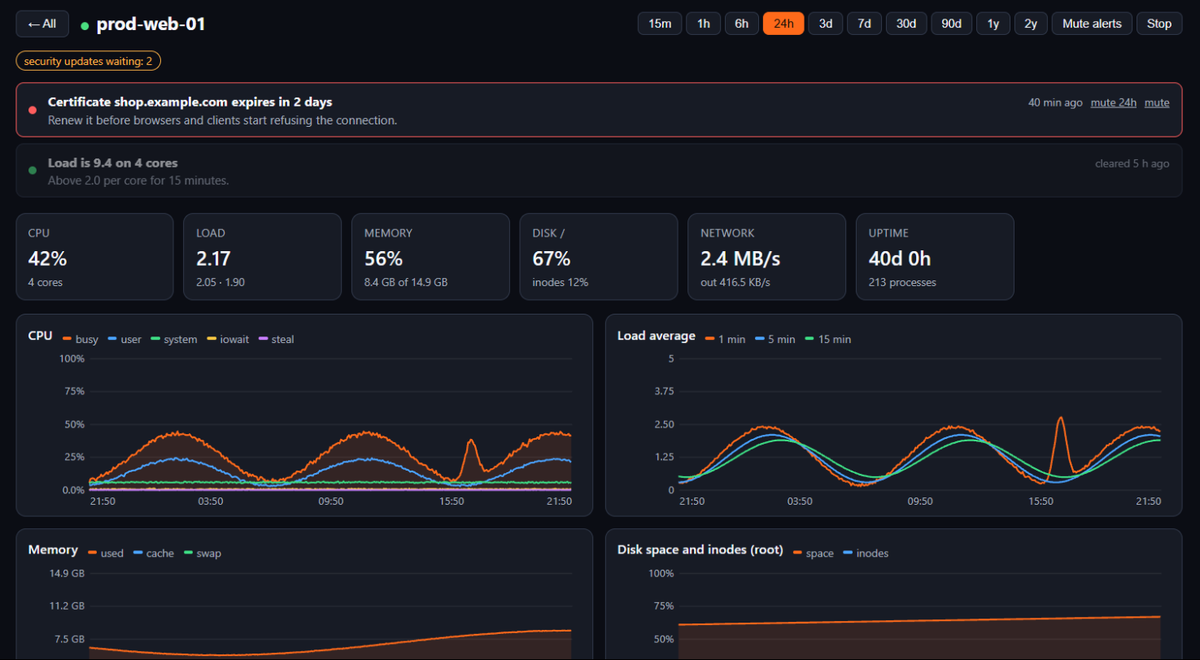
- ▸CPU and load — busy, user, system, iowait and steal; load average; pressure (PSI).
- ▸Memory and swap, disk space and inodes, disk I/O and disk busy.
- ▸Network in and out, TCP sockets, open files, processes.
- ▸What is running — containers, failed services, failed SSH sign-ins, pending security updates.
- ▸Tables — disks, top processes by CPU, containers, TLS certificates with days to expiry, failed services, listening ports.
History is kept for 90 days on Pro and two years on Team. The most recent two weeks are at one-minute detail; older history is kept as five-minute and then hourly averages that keep the peak of each interval.
02 / alerts
Alerts that work before you configure anything.
Every monitored server is watched with default thresholds. You can change them; you do not have to.
- ▸Disk — nearly full (warning at 90%, critical at 95%), or forecast to fill within a day. Inodes running out.
- ▸Memory and CPU — memory pinned, load high for a sustained time, CPU time taken by the hypervisor (steal), an out-of-memory kill.
- ▸Services and containers — a failed systemd service; a container that keeps restarting or is unhealthy.
- ▸Certificates — a TLS certificate about to expire: 14 days ahead, critical at 3.
- ▸The server itself — restarted; offline (after three minutes, so a reboot is not an alert); a connection that keeps dropping.
03 / built to be quiet
One message when it breaks. One when it clears.
An alert is only useful if it gets read, so the defaults keep the number of messages down.
- ▸Once in, once out. One message when a problem opens and one when it clears.
- ▸Grouped. Several problems within a few minutes arrive as one message. A critical one never waits.
- ▸No repeats by default. A problem that comes back the same day is not sent again, unless it is critical and lasts.
- ▸A calm first day. On the first day a server is monitored, only critical alerts are sent. Routine failed units and leftover expired certificates are ignored.
- ▸Mute. Silence one kind of alert on one server, or a whole server.
04 / channels
Where alerts go.
- ▸Email — the default.
- ▸Push to the iOS app.
- ▸Telegram — one tap to connect the bot.
- ▸Webhook — one that Slack and Discord accept as is. Requests are signed (HMAC-SHA256).
05 / how it works
What is read, and how.
There is no monitoring agent. Once a minute Termalin runs a few read-only commands — /proc, df, ps and similar — over the Connector's existing connection. The cost to the server is a few milliseconds of CPU and about a kilobyte a minute.
- ▸On by default, yours to switch off. One switch for all servers and one per server, under Server metrics. Switching it off erases what was collected for that server.
- ▸Not end-to-end encrypted. These numbers are stored in a form the service can read — it has to read them to draw charts and raise alerts.
- ▸Listed in full. What is read is listed in the privacy policy, under Server metrics and alerts.
- ▸In the web cabinet for now. Dashboards live at termal.in/account; the desktop app does not show them yet. The iOS app receives the pushes.
06 / AI apps
"How are my servers doing?" — answered from data.
Through Termalin's hosted MCP endpoint, Claude and ChatGPT can read the same numbers and the same alerts: server_metrics returns the numbers, alerts_list returns the alerts. The answer comes from what monitoring has collected.
07 / plans
Part of Pro and Team.
Monitoring needs a Connector, and Connectors are a paid-plan feature — so monitoring and alerts come with Pro (90 days of history) and Team (two years). The 14-day Pro trial includes them. They are not on Free. See pricing →
Questions
Does server monitoring install anything on my server?
No. It works for every server that already has a Termalin Connector, and adds nothing to it: no second agent, no exporter, no open port. Once a minute Termalin runs a few read-only commands (/proc, df, ps and similar) over the connection the Connector already holds.
What does it cost the server in resources?
A few milliseconds of CPU and about a kilobyte a minute.
How long is the history kept?
90 days on Pro and two years on Team. The most recent two weeks are kept at one-minute detail; older history is kept as five-minute and then hourly averages, each with the peak of its interval, so a short spike still shows on a long chart.
Can I turn monitoring off?
Yes. There is one switch for all servers and one for each server, in the web cabinet under Server metrics. Switching it off erases what was collected for that server. Alerts only work for servers with monitoring on.
Where do alerts go?
To email by default. You can add a push to the iOS app, Telegram (one tap connects the bot) and a webhook that Slack and Discord accept as is. Webhook requests are signed with HMAC-SHA256.
Do I have to write alert rules?
No. Every monitored server is watched with default thresholds — disk, inodes, memory, load, failed services, containers, certificates, the server going offline. You can change the thresholds, or mute one kind of alert on one server, but you do not have to set anything up.
Is this a replacement for Grafana and Prometheus?
No. It is the zero-setup baseline: the standard health figures of a server and a default set of alerts, with nothing to deploy. It has no log collection, no custom metrics, no uptime checks from outside and no status pages. If you already run a full observability stack, keep it; if you have servers nobody is watching at all, this watches them.
Connect a server, and it is watched.
One line installs the Connector. Monitoring is on by default, and alerts need no setup. New accounts get Pro free for 14 days.
Pro and Team · 14-day Pro trial · Connector · what is read